Issues related to performance can be complicated to resolve since there are usually several different entities involved in a SMS transaction and you do not have control of all of these.
We here consider a full transaction to include EMG receiving the message, forwarding the message, receiving back a delivery report and forwarding the delivery report.
Usually the recipient will receive the message shortly after the message has been forwarded to SMSC.
The diagram below illustrates the operations sent and received as part of a full transaction. T1 to T7 represents the different parts (or delays) of the accumulated time to complete the transaction.
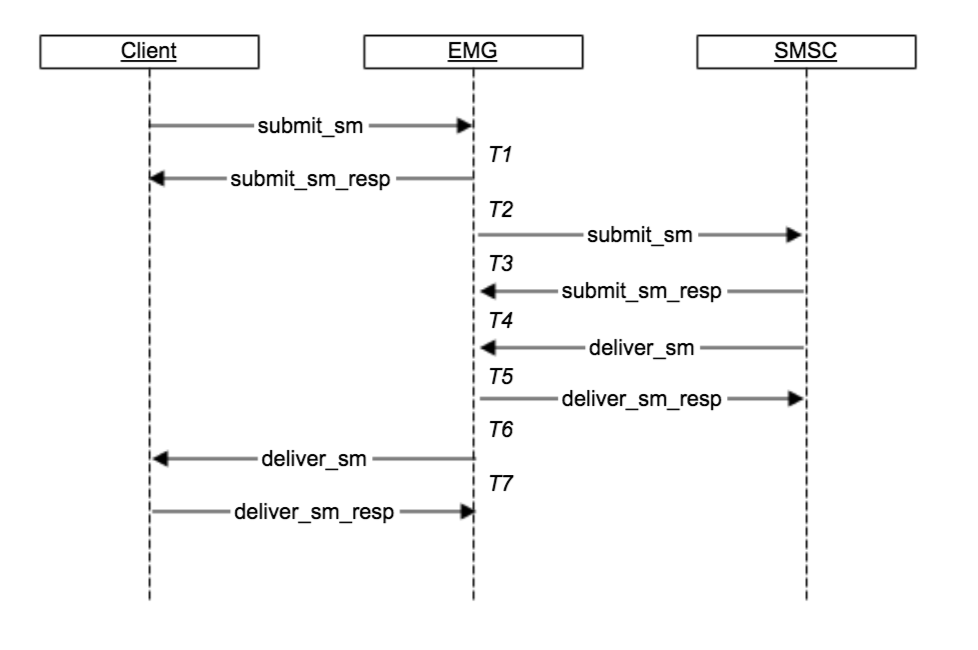
The easiest way to quantify T1-T7 for a transaction is to find the corresponding pdus for the transaction (in the pdu log files for each connector involved) and calculate T1 to T7 using the timestamp for each pdu.
Delays
Delay T1
When a message is received by EMG the routing logic will be triggered before the response is sent back to the client.
Often this delay will be small but if more complex routing logic is handled via a plugin and that plugin in turns queries a database or external systems then the delay can be substantially higher.
Throttling (via license or configured) can also affect the delay. If there is a 10 mps limitation the response will be delayed 0.1 seconds on average.
Delay T2
If there is a queue on the connector which sends out the message then T2 will represent the time the message spends in the queue.
Another possibility in larger T2 delays is if EMG is not already connector to the remote end and even worse if a connection cannot be established due to network issues or other issues on remote end.
Delay T3
The delay before remote end sends back a response is out of control for EMG.
If there is a substantial network latency or delay before the response is received back it can sometimes improve the situation by using an increased window size for the connector meaning that multiple message can be submitted in parallell and thereby somewhat mitigate the impact caused by network latency.
Delay T4
The time until a delivery report is received back is also out of control for EMG and a delayed delivery report does not necessarily mean the message delivery was delayed.
Delay T5
The routing logic for delivery reports is usually less complex than the message routing logic and usually no plugins or external systems are involved.
Delay T6
Delivery of the delivery report back to the client depends on the client being connected to EMG in order for delivery to be possible.
Potentially there can also be a queue for the client on the connector. For clients which a lot of traffic an increased window size can also improve delivery performance.
Delay T7
The delay before client sends back a response for the delivery report is out of control for EMG.
Profiling log
The log file “profiling” will log activities that take more than a specified time to complete (for example a database call).
When EMG runs with log level DEBUG the profiling log will log all activities.
Using general keyword PROFILING_THRESHOLD can set the minimum time required for an activity to be logged.
For example
PROFILING_THRESHOLD=0.2will only log entries that take 0.2 seconds or more to complete.
PDU log files
The pdu log files contains the “raw” operations sent back and forth between EMG and remote end.
In order to find relevant entries in the log files you usually need to use “grep” command from command-line.
The easiest search term to start out with is normally the destination number for the message.
For example:
$ grep -A 1 4670123456 pdu.smpp-in1
2017-12-21 17:25:48.061669 INFO     (smpp-in1,5) Read op:0x00000004 (SUBMIT_SM) status:0 trn:98927 datalen:71 SOURCEADDRTON:5 SOURCEADDRNPI:0 SOURCEADDR:Test DESTADDRTON:1 DESTADDRNPI:1 DESTADDR:4670123456 ESMCLASS:0 PROTOCOLID:0 PRIORITYFLAG:0 REGISTEREDDELIVERY:0 REPLACEIFPRESENT:0 DATACODING:0 SMDEFAULTMSGID:0 SMLENGTH:31 SHORTMESSAGE:414243
2017-12-21 17:25:48.066653 INFO     (smpp-in1,5) Write op:0x80000004 (SUBMIT_SM_RESP) status:0 trn:98927 datalen:9 MESSAGEID:62375356
In the above example we search for destination number (recipient address) “4670123456” in the pdu log for the connector “smpp-in1” where the message is supposed to be received. Please note that the “submit_sm” operation is “Read” by EMG (received by EMG) while the “submit_sm_resp” entry has a “Write” (sent by EMG).
Using “-A 1” option we also include the line immediately following any matching lines in hope to also see the response, which we do in this case. Since the connector instance “smpp-in1,5” is the same and the “trn” value for the two lines is also the same (“98927”) we are sure that response seen is indeed the correct response. Sometimes there will be other entries logged between the operation and response lines and you would then need to use “grep -A 20” to include more lines to find the corresponding response.
The timestamps for the above entries indicate a T1 delay of 0.004984 seconds, around 5 milliseconds.
Continuing on to the pdu log for the connector where the message is sent out:
$ grep -A 1 4670123456 pdu.smpp-out1
2017-12-21 17:25:48.067724 INFO     (smpp-out1,0) Write op:0x00000004 (SUBMIT_SM) status:0 trn:72592 datalen:70 SOURCEADDRTON:5 SOURCEADDRNPI:0 SOURCEADDR:Test DESTADDRTON:1 DESTADDRNPI:1 DESTADDR:4670123456 ESMCLASS:0 PROTOCOLID:0 PRIORITYFLAG:0 REGISTEREDDELIVERY:1 REPLACEIFPRESENT:0 DATACODING:0 SMDEFAULTMSGID:0 SMLENGTH:31 SHORTMESSAGE:414243
2017-12-21 17:25:48.076734 INFO     (smpp-out1,0) Read op:0x80000004 (SUBMIT_SM_RESP) status:0 trn:72592 datalen:33 MESSAGEID:16079e523250004c7d9944f1d8fca571
Once again we verify that the two lines have the same instance and trn info in order to ensure that they are related before we calculate the T2 and T3 delays.
So, delay T2 would be 17:25:48.067724 – 17:25:48.066653 = 0.001071, around 1 millisecond, and delay T3 would be 0.009010, around 9 milliseconds.
And for the delivery report:
2017-12-21 17:25:49.557977 INFO     (smpp-out1,0) Read op:0x00000005 (DELIVER_SM) status:0 trn:72557 datalen:205 SOURCEADDRTON:1 SOURCEADDRNPI:1 SOURCEADDR:4670123456 DESTADDRTON:5 DESTADDRNPI:0 DESTADDR:Test ESMCLASS:4 PROTOCOLID:0 PRIORITYFLAG:0 REGISTEREDDELIVERY:0 DATACODING:3 SMLENGTH:124 SHORTMESSAGE:69643A3136303739653532333235303030346337643939353866316438666361353561207375623A30303120646C7672643A303031207375626D697420646174653A3137313232313136323520646F6E6520646174653A3137313232313136323520737461743A44454C49565244206572723A30303020746578743A MESSAGESTATE2:2 RECEIPTEDMESSAGEID:16079e523250004c7d9958f1d8fca55a
2017-12-21 17:25:49.559475 INFO     (smpp-out1,0) Write op:0x80000005 (DELIVER_SM_RESP) status:0 trn:72557 datalen:1
Here we see that the address is present as “source address” for the delivery report, in other words source and destination addresses are swapped in the delivery report.
First we verify correct instance and trn info and then we calculate delays. T4 would be 1.48 seconds here and T5 would be around 1.5 milliseconds.